Shipbuilding - Progress Report
When I was a shipbuilding surveyor intern, I understood that the site Superintendent plays a vital role in ensuring the safety and compliance of ships under construction. They must guarantee that every step is in accordance with the rules, drawings, and safety. And one important tool that can aid in this process is a dashboard for tracking and following up on inspections.

A dashboard allows the site superintendent and their manager to have a clear overview of the inspections that have been conducted, the results of those inspections, and any outstanding issues that need to be addressed. This allows the site Sup. to prioritize their workload and ensure that all critical tasks and issues are dealt with in a timely manner.
Additionally, a dashboard can help streamline communication between the inspector and other stakeholders involved in the shipbuilding process, such as the shipyard, the shipowner, and regulatory authorities. For example, if the superintendent needs to present and discuss the progress of a specific hull, they can quickly and easily inform the relevant parties and track the progress and provide corrective actions to be taken.
Another important aspect of the dashboard is the ability to store and archive all inspection reports, which can be submitted by a simple mobile or browse application.
Further, it can help make it easier for the responsible to access historical data. This would be useful when tracking trends and patterns in shipbuilding and identifying areas that may require further attention in the future.
Overall, a dashboard can significantly increase the efficiency and effectiveness of a shipbuilding project. It allows them to manage their workload more effectively, communicate more easily with other stakeholders, and ensure the safe and compliant construction of ships.
**NOTE: These tasks, blocks, and information are summarized. For real shipbuilding, there is a lot more information to input. Although the data structure is basically the same.
Live Report here

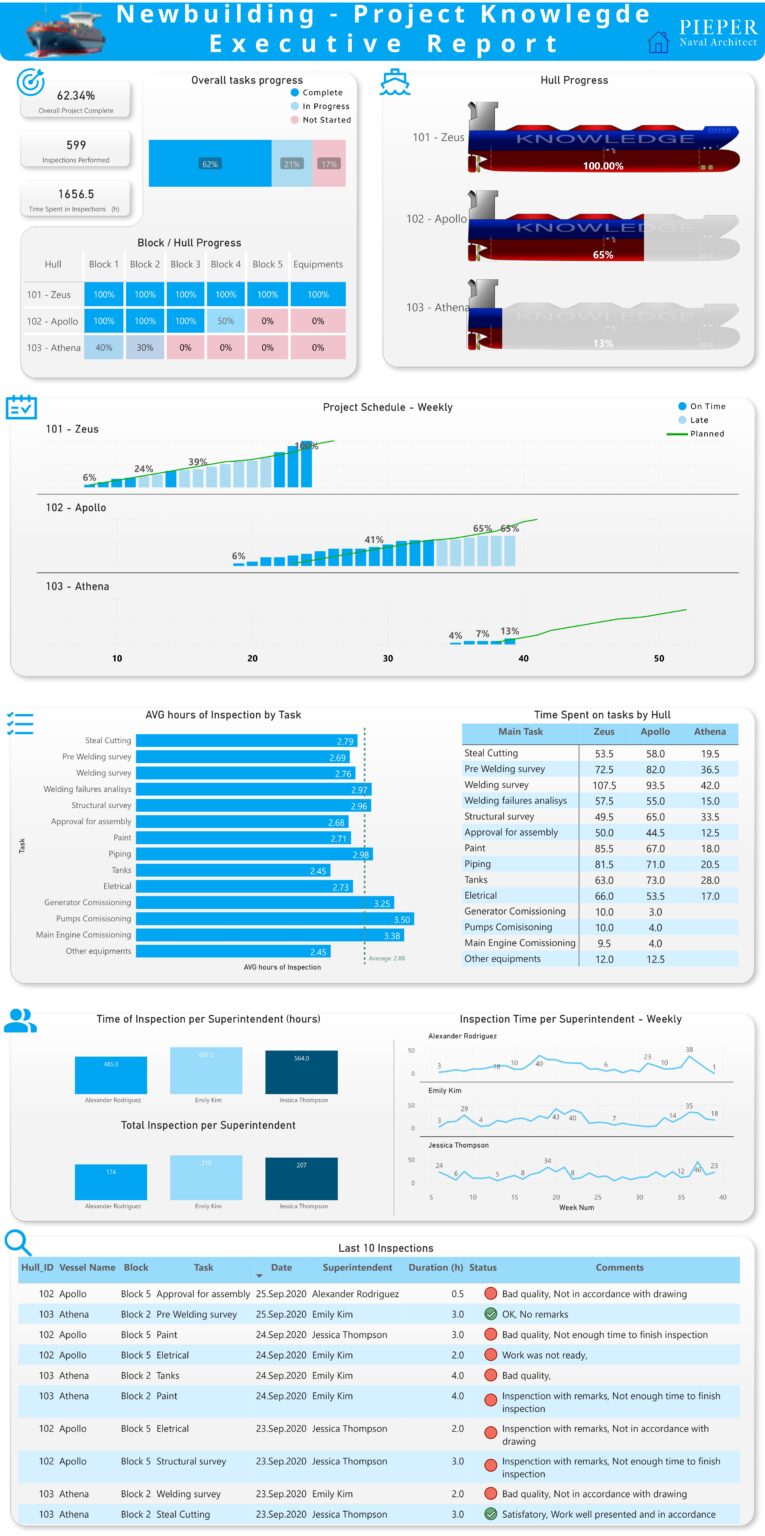
A full executive report can help the project manager to track the progress of the construction. Some of the insights that can be seen are, if the project is on schedule, time spent by the Site Superintendents per inspection, the progress of each block/hull, and several others depending on the data that are submitted.
On this page, for example, I separated into sections, Hull – Schedule – Task – People.
✅ Hull, you can view the overall progress for each hull and open by block progress.
✅ Schedule, you can track if the project is in accordance with what was planned
✅ Tasks, you can view the average time spent per inspection and the total time of inspection open by hull.
✅ On the people section, you can check the time and total inspection per Superintendent, as well the evolution over time of the workload.
✅ The last table is an overview of the last 10 inspections performed.
Al this can be considered within a timeline, weekly, monthly…
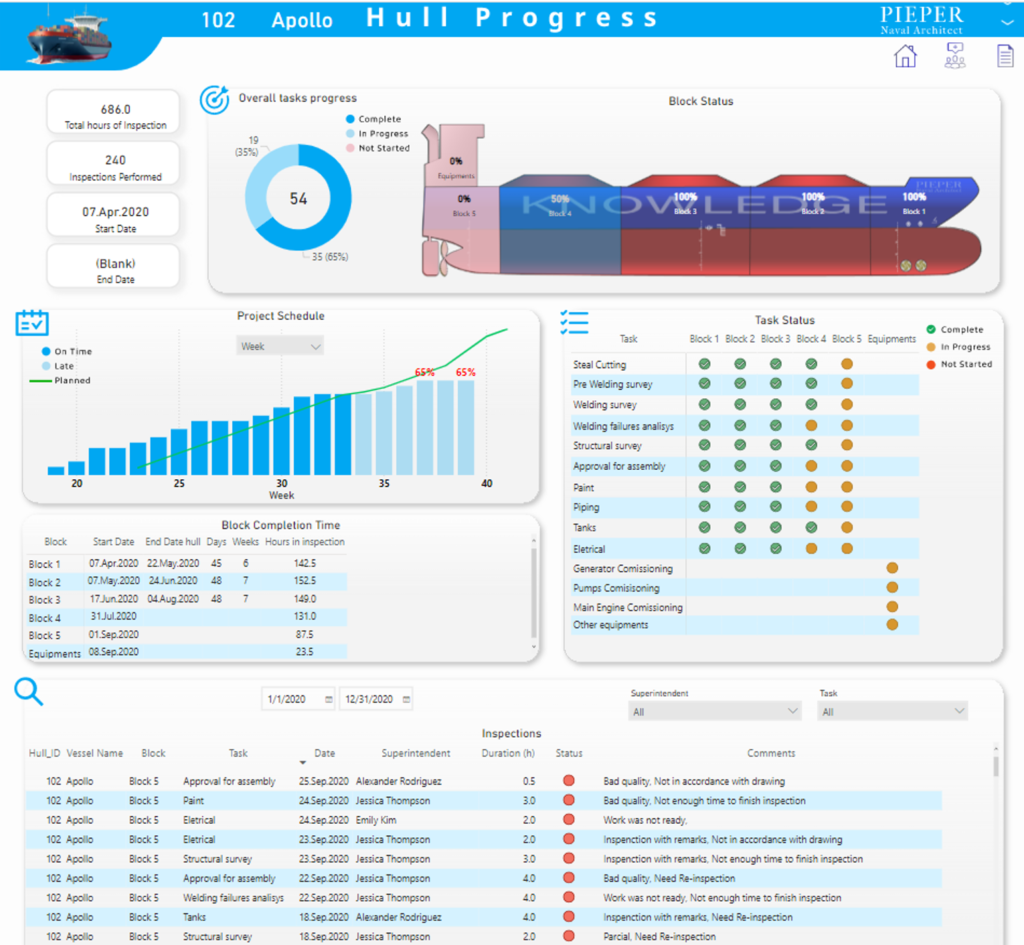
On the hull progress page, I bring the user a full overview of the tasks for the specific selected hull ID.
At first, an overall task progress and block progress, which the user can hover the mouse to see the task status.
Then it shows the schedule vs. planned, start/end date for each block and the duration to complete the block.
The table at the bottom is the full list of inspections performed for this selected hull

How to enter the data?
An easy way to submit the data for this report is a simple PowerApps application, with a few pages to enter the data of a new inspection and view past inspections.
This app then is connected tho the same Database of the dashboard, automatically updating this.

